%2520Risk%2520Management%2520Framework.png)

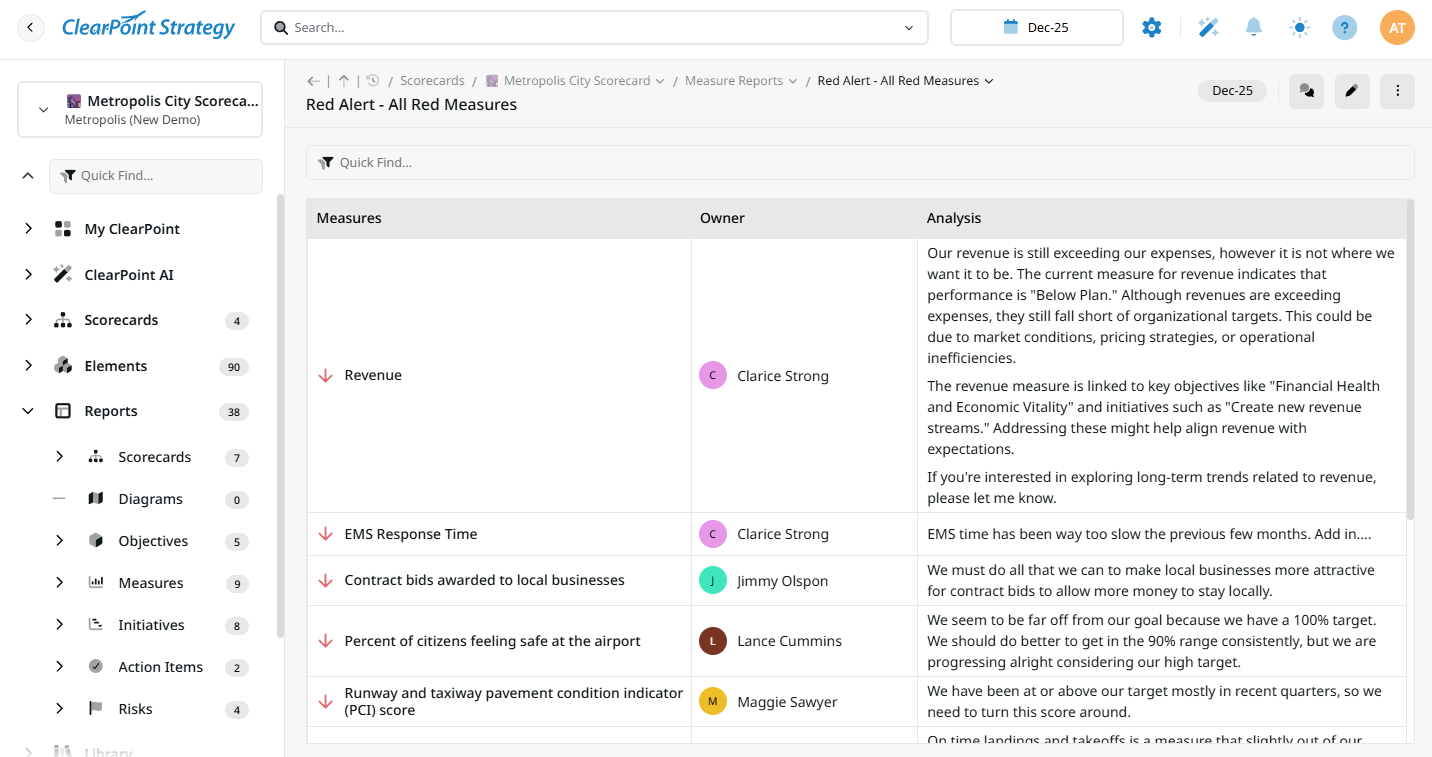
We analyzed 20,582 strategic plans. 86% documented no risk at all. Here's why risk frameworks fail — and how to tie risk to the strategy it protects.
Somewhere in your building, there is a risk register. It might be a spreadsheet. It might be a binder from last year’s offsite. It lists the things that could sink you — and almost no one has opened it since the meeting that made it.
You’re not alone. We analyzed 20,582 strategic plans for our 2026 Strategic Planning Report. Then we counted how many actually tracked a risk. The answer should stop you cold.
Eighty-six percent contained none. Not one documented risk.
The median plan we studied tracked six KPIs, one project, and one objective. Risks: zero. Organizations measure what they want to achieve in fine detail. What could stop them gets filed away, out of sight.
Here’s the part that matters. Your framework isn’t the problem. NIST, ISO 31000, COSO — they’re well-built and freely available. The problem is that risk lives in a separate document, cut off from the strategy it’s supposed to protect.
This guide covers the frameworks that matter, when to use each, and how to actually run one. But it starts where most guides won’t: with what the data says you’re probably doing wrong.
ClearPoint 2026 Strategic Planning Report
Risk is the rarest thing in a strategic plan
Share of plans that track each element type (n = 11,289 plans with content)
Measures (KPIs)
79.5%
Objectives
64.7%
Projects
56.5%
Milestones
26.6%
Action items
18.5%
Risks
13.8%
Source: ClearPoint analysis of 20,582 strategic plans (2017–2024).
Share this data:in ShareX PostGet the 2026 Report →
Most organizations are flying blind on risk
Let’s stay with the numbers. They tell the story better than any metaphor.
Of the 20,582 plans in our dataset, 11,289 held real content — objectives, KPIs, projects. Among those, just 13.8% included a single documented risk. Fewer than one in seven.
What the median strategic plan tracks
Organizations measure their ambitions in detail — and their risks not at all.
6
KPIs
1
Project
1
Objective
0
Risks
Median element counts per plan. Source: ClearPoint analysis of 20,582 strategic plans (2017–2024).
Risk wasn’t merely under-tracked. It was the rarest element in a strategic plan. Teams logged measures, milestones, initiatives, even routine action items far more often. Risk came dead last.
Zoom into one organization at a time and it gets no better. One in three never documented a single risk anywhere on the platform.
And when a risk did get written down, most of the time nobody owned it. 88.6% of the risks in our data had no assigned owner. For KPIs, that figure is 67%. For projects, 57%. Risk is the most abandoned item in the whole system — a note to self that no one signed.
When risk is logged, no one owns it
Risk is the most orphaned element type — more likely to lack an owner than KPIs, projects, or objectives.
88.6%
of risks have no owner
NO-OWNER RATE BY ELEMENT TYPE
Risks
88.6%
Objectives
77.6%
Milestones
71.2%
KPIs
67.0%
Action items
60.9%
Projects
57.2%
Source: ClearPoint analysis of 20,094 documented risks across 20,582 strategic plans (2017–2024).
This isn’t a ClearPoint quirk. North Carolina State University’s 2025 State of Risk Oversight surveyed hundreds of organizations. Only 11% said their risk process gave them a strategic edge. We found 13.8% in our platform data. They found 11% in their survey. Two datasets, one conclusion: risk and strategy rarely sit in the same room.
What a risk management framework actually does
Strip away the jargon and a risk management framework does three things. It helps you spot what could go wrong. It helps you decide what to do about it. And it keeps you watching, so a small problem doesn’t become a headline.
That’s the whole job. The rest is structure — and structure is where the major frameworks differ.
Three matter for most organizations.
COSO ERM — built for strategy
COSO is the one to know first, because of what it did in 2017. It renamed its framework “Enterprise Risk Management — Integrating with Strategy and Performance.” Read that title again. The most influential body in risk management decided the headline wasn’t controls. It wasn’t compliance. It was strategy. COSO’s own argument: risk had been treated as a side activity, judged only after the strategy was already set. They wanted it built in from the first decision.
ISO 31000 — principles over checklists
ISO 31000:2018 is the international standard. It’s principles-based, not prescriptive — guidelines, not a controls catalog. Its very first principle is one word: “Integrated.” Risk management, ISO says, is part of every organizational activity. Not a department. Not an annual event.
NIST RMF — built for security and compliance
The NIST Risk Management Framework (SP 800-37, Revision 2) runs seven steps: Prepare, Categorize, Select, Implement, Assess, Authorize, Monitor. It’s rigorous, and it’s the backbone of U.S. federal cybersecurity. It’s also the most controls-first of the three — designed to protect information systems, not to set company strategy. If you’re a federal agency or you handle sensitive data, you’ll likely use it. Just know what it’s built for.
FrameworkBest forStructureStrategy-integrated?COSO ERMEnterprises & boards tying risk to strategy5 components, 20 principlesYes — by design (2017)ISO 31000:2018Flexible, any size or sectorPrinciples + framework + processYes — principle #1 IntegratedNIST RMFFederal, security & compliance7 steps (Prepare to Monitor)Indirect — controls-firstNIST AI RMFOrganizations deploying AI4 functions: Govern, Map, Measure, ManageVia governance function
One more, if you’re deploying AI
If you’re putting AI to work — and in government, many of you now are — there’s a fourth worth knowing. NIST released its AI Risk Management Framework in 2023, organized around four functions: Govern, Map, Measure, Manage. In 2024 it added a Generative AI Profile naming twelve risks specific to generative systems, from hallucination to data poisoning. AI risk is its own discipline now. We go deep on it in our AI Governance guide.
Notice the pattern. COSO’s 2017 rewrite and ISO’s first principle say the same thing. Integrate risk with strategy. The guidance has been clear for nearly a decade. The execution hasn’t followed.
Most teams build their framework backwards
Here’s where good intentions go wrong.
Most teams adopt a framework by starting with its controls. They download the NIST 800-53 catalog. They build a risk register in a tab that links to nothing. They populate it, score it, and feel safer. Then the register and the strategy never speak again.
That’s backwards. A control protects something. A risk threatens something. If you don’t start from what you’re trying to achieve — your strategic objectives — you’re cataloguing hazards in the abstract. A risk that isn’t attached to an objective is just anxiety in a spreadsheet.
Our data shows how arbitrary the result becomes. We measured how often each industry documents risk in its plans. If risk tracking followed actual danger, you’d expect the high-stakes sectors on top.
Who documents risk — and who doesn’t
Share of strategic plans containing at least one documented risk, by sector. The pattern follows regulation, not real danger.
State Government
30.6%
County Government
25.7%
Financial Services
12.3%
Municipal Gov.
11.4%
Non-Profit
9.5%
Higher Education
8.1%
Healthcare
7.9%
Technology
7.5%
Utilities
6.9%
Healthcare — where risk is measured in human outcomes — documents a risk in fewer than 1 in 12 plans.
Source: ClearPoint analysis of 20,582 strategic plans (2017–2024). Sectors with fewer than 200 sampled plans omitted.
It’s the opposite.
State governments lead at 30.6%, pushed there by audit mandates and compliance rules. Counties follow at 25.7%. Then it falls off a cliff. Financial services: 12.3%. Healthcare — where risk is measured in human outcomes — documents a risk in just 7.9% of its plans. Manufacturing, with physical safety on the line every shift, sits near the very bottom.
The pattern doesn’t follow danger. It follows habit. Where a regulator forces the discipline, it happens. Where it’s left to good intentions, it doesn’t. That alone should tell you the framework was never the real issue.
What 15 years of Balanced Scorecard work taught me about risk
A note from Ted Jackson, co-founder of ClearPoint.
I’ve spent more than fifteen years putting the Balanced Scorecard to work. Inside hundreds of organizations. Owners on every objective. Targets on every measure. A review rhythm that kept it all honest.
The Scorecard works because it makes the upside a system. Goals stop being wishes. They get names attached and dates that matter.
Here’s what I watched, again and again. The same teams that ran their objectives with that discipline handled risk completely differently. Once a year, in a conference room, someone would lead a brainstorm. The list went into a document. The document went into a drawer. The next time anyone looked at it was eleven months later, in the same room.
We treat the upside as a system and the downside as an event.
The Balanced Scorecard always implied risk. You can’t chase an objective without managing what threatens it. But almost no one extends the Scorecard’s discipline — owners, cadence, accountability — to the things that could derail the plan. The data we see today is that gap, written at scale. 88.6% of documented risks with no owner is the same failure I watched in those rooms. Multiplied by twenty thousand plans.
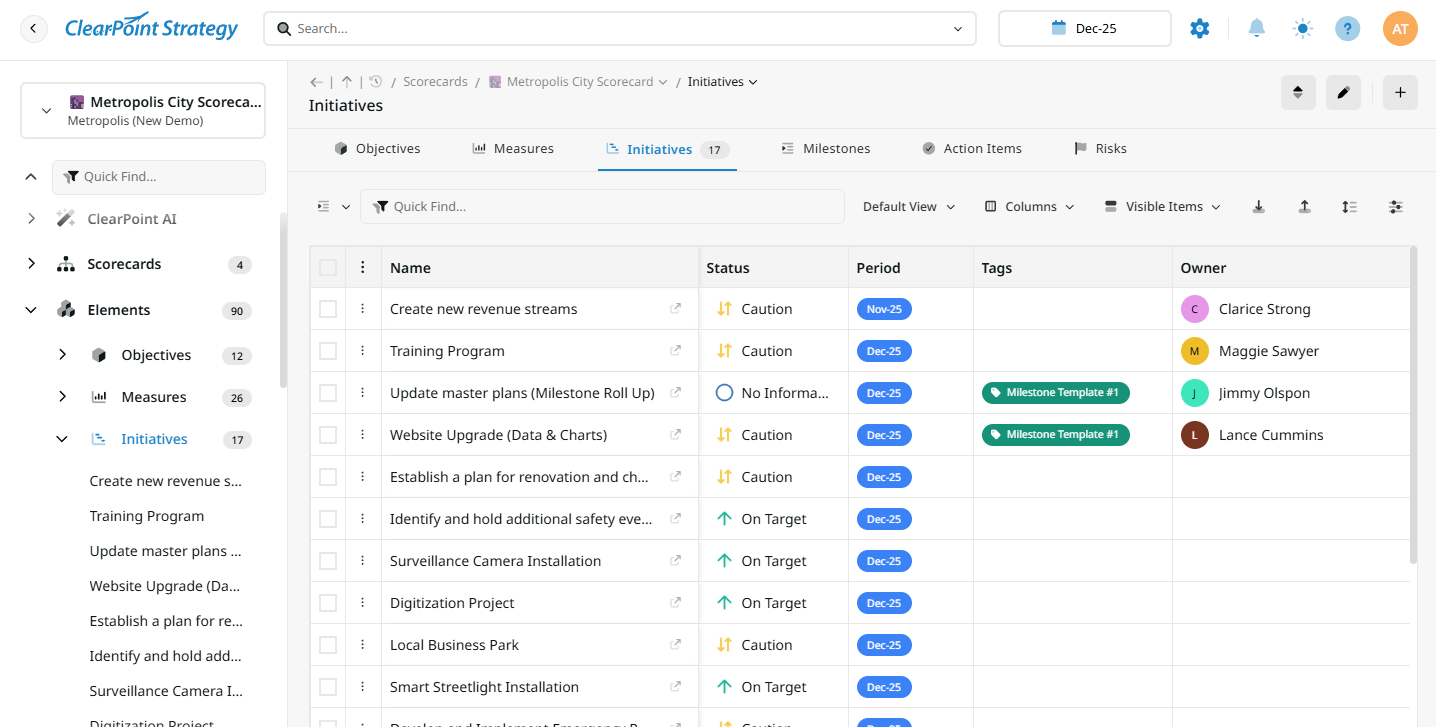
How we rebuilt our own risk process
We’ll be honest. For years, we made the exact mistake the data describes.
Our annual risk assessment was a one-day exercise. The whole company in a room, brainstorming what could go wrong. We’d build a list and assign a few action items. Then the list sat there. We had no follow-up to report on those actions. And — the part that stings — it wasn’t linked to our strategy in any meaningful way. It existed as a separate, standalone effort. The full-room format had another flaw, too: only managers and senior leaders ever spoke up.
So we rebuilt it. Here’s the process we run now.
First, each department brainstorms its own risks — tied to the company’s strategic objectives, not in the abstract. A short questionnaire guides the conversation. Customer success looks at what threatens its goals. Product looks at its own. The people closest to the work name the risk.
Second, department heads meet with leadership to clean the list. Cut duplicates. Group by theme. Confirm each risk maps to a real objective. Some risks touch several.
Third, we score each one. Not with a vague high/medium/low. We rate impact on a 1–5 scale, then estimate probability over two horizons — one year and five years. A risk that’s unlikely next quarter but likely over five years gets seen, not buried. The averaged score points to a response: avoid it, reduce it, mitigate it, transfer it, or accept it on purpose.
Fourth — and this is the whole point — every risk action item links to a strategic objective inside ClearPoint. We report on them quarterly, in the same reviews where we report on our KPIs.
The change wasn’t the framework. We didn’t adopt COSO or rewrite our charter. The change was location. Risk moved out of the annual binder and into the system we already used every quarter to run the company. More people own it now. It doesn’t go stale.

The strategy-first way to run any framework
You don’t need our exact process. You need the principle underneath it: risk belongs in the same system, on the same cadence, as your strategy. Whatever framework you adopt — COSO, ISO, NIST — here’s how to wire it in.
1. Start from objectives, not hazards. List what you’re trying to achieve first. Then ask, for each: what could stop this? You’ll end up with risks that matter, not a generic catalog.
2. Source risks from the people closest to the work. Department-up beats top-down. The frontline sees the failure modes leadership can’t.
3. Score on two horizons. Impact times likelihood is standard. Add a time dimension — near-term and long-term — so slow-building risks don’t hide.
The risk matrix: impact × likelihood
It sorts risk. It doesn’t manage it — that’s the job of an owner and a cadence.
Impact ↓MedHighCritCritCritMedMedHighCritCritLowMedMedHighHighLowLowMedMedHighLowLowLowMedMedRareUnlikelyPossibleLikelyAlmost certainLikelihood →
Score each risk on impact (1–5) and likelihood across two horizons (1-year and 5-year), then assign a response.
A quick word on the risk matrix, since it’s the tool most people picture. It plots impact against likelihood, usually on a 5×5 grid. High impact, high likelihood — act now. Low and low — watch and wait. It’s useful. It’s also where many teams stop, which is the mistake. The matrix sorts risk. It doesn’t manage it.
4. Give every risk an owner. This one step kills the 88.6% problem. A risk without a name is a risk no one is watching.
5. Choose a response and a control. Avoid, reduce, mitigate, transfer, or accept. Write it down. Assign it.
6. Pair KRIs with your KPIs. A KPI tells you if you’re winning. A Key Risk Indicator warns you before you start losing. If your KPI is on-time delivery, a matching KRI might be supplier defect rate. Set the threshold from your risk appetite — the level of risk you’ve decided you can live with. When the KRI crosses it, you act before the KPI ever moves.
Quick definitions, because the terms get muddled. Risk appetite is qualitative — “we won’t tolerate a compliance breach.” Risk tolerance is the number — “no more than 1.5% credit loss.” Appetite is the principle. Tolerance is the line.
7. Review risk on the same cadence as strategy. Monthly or quarterly — whatever rhythm you already use for KPIs. The goal is simple: risk should never be more than one review cycle away from attention.
Which framework should you actually use?
Short answer: it matters less than you think. The discipline of wiring risk into strategy matters more than the logo on the framework. But here’s a clean way to choose.
- Choose COSO ERM if you’re an enterprise, or a board wants risk tied to strategy and performance. It’s the most strategy-native of the three.
- Choose ISO 31000 if you want flexible, principles-based guidance you can adapt to any size or sector. It won’t hand you a checklist. That’s the point.
- Choose NIST RMF if you’re a federal agency, a contractor, or you manage sensitive systems. It’s built for security and compliance, and it’s often required.
- Add the NIST AI RMF if you’re deploying AI. The other three weren’t written with model risk in mind.
Pick one. Then spend your energy on the part that actually fails — execution — not on the choice itself.
The four ways risk frameworks die
Frameworks don’t fail on paper. They fail in practice, in a handful of predictable ways. We see all four in the data.
The write-only register. Risks get logged and never closed. In our dataset, only 3% of documented risks were ever marked complete. The register fills up. Nothing leaves. It becomes a museum of worries.
The orphaned risk. 88.6% with no owner. A risk everyone can see and no one is responsible for is a risk that will surprise you.
The annual event. The once-a-year offsite that produces a list and no follow-through. If risk gets attention in one meeting a year, it isn’t managed. It’s commemorated.
The controls-first inversion. Starting with a catalog of controls instead of the objectives you’re protecting. You end up busy and unprotected at the same time.
Put risk where you’ll actually see it
Risk management isn’t a binder. It isn’t an annual meeting or a tab in a spreadsheet. It’s the discipline of looking at what could stop you — with the same seriousness you bring to what you’re chasing.
The frameworks already know this. The standards already say it. What’s missing is the simplest thing of all: putting risk where you’ll actually see it.
A strategy that only plans for success isn’t a strategy. It’s a wish. The organizations that last are the ones that write down what could go wrong — and then keep looking.
Related Articles
- ClearPoint Kanbans for Risk Management
- How We Built Our Annual Risk Assessment Process at ClearPoint
- 20 Essential Strategic Frameworks for Effective Management
- ESG Reporting: A Practical Guide
- Effective Strategic Planning: A Comprehensive Example Guide
Frequently Asked Questions
What is a risk management framework?
A risk management framework is a structured way to identify what could go wrong, decide what to do about it, and monitor it over time. The most common are COSO ERM, ISO 31000, and the NIST Risk Management Framework. The framework you choose matters less than whether you connect it to your strategy — in our analysis of 20,582 strategic plans, 86% documented no risk at all.
What are the main risk management frameworks?
Three dominate. COSO ERM is built to integrate risk with strategy and performance. ISO 31000:2018 is a principles-based international standard. The NIST RMF (SP 800-37) is a seven-step framework for security and compliance. If you deploy AI, the NIST AI Risk Management Framework adds a fourth, organized around Govern, Map, Measure, and Manage.
What percentage of organizations actually document their risks?
Fewer than you’d think. In our 2026 analysis of 20,582 strategic plans, only 13.8% of plans with real content included a single documented risk. North Carolina State University’s 2025 survey reached a parallel finding: just 11% of organizations said their risk process gave them a strategic edge.
What’s the difference between a KRI and a KPI?
A KPI (Key Performance Indicator) measures progress toward a goal — it tells you if you’re winning. A KRI (Key Risk Indicator) is an early-warning signal — it tells you before you start losing. The two work best paired: a KPI for the objective, a KRI for the risk that threatens it.
How often should you review your risks?
On the same cadence as your strategy — monthly or quarterly. The most common failure mode is the annual offsite that produces a list nobody revisits. Risk should never be more than one review cycle away from attention.
Which risk management framework is best?
There’s no universal best. Choose COSO ERM for board-level, strategy-integrated risk; ISO 31000 for flexible, principles-based guidance; NIST RMF for security and federal compliance. Then put your energy into execution — that’s where frameworks actually fail.

%20OKRs%20Meaning%20A%20Practical%20Guide.png)