.svg)
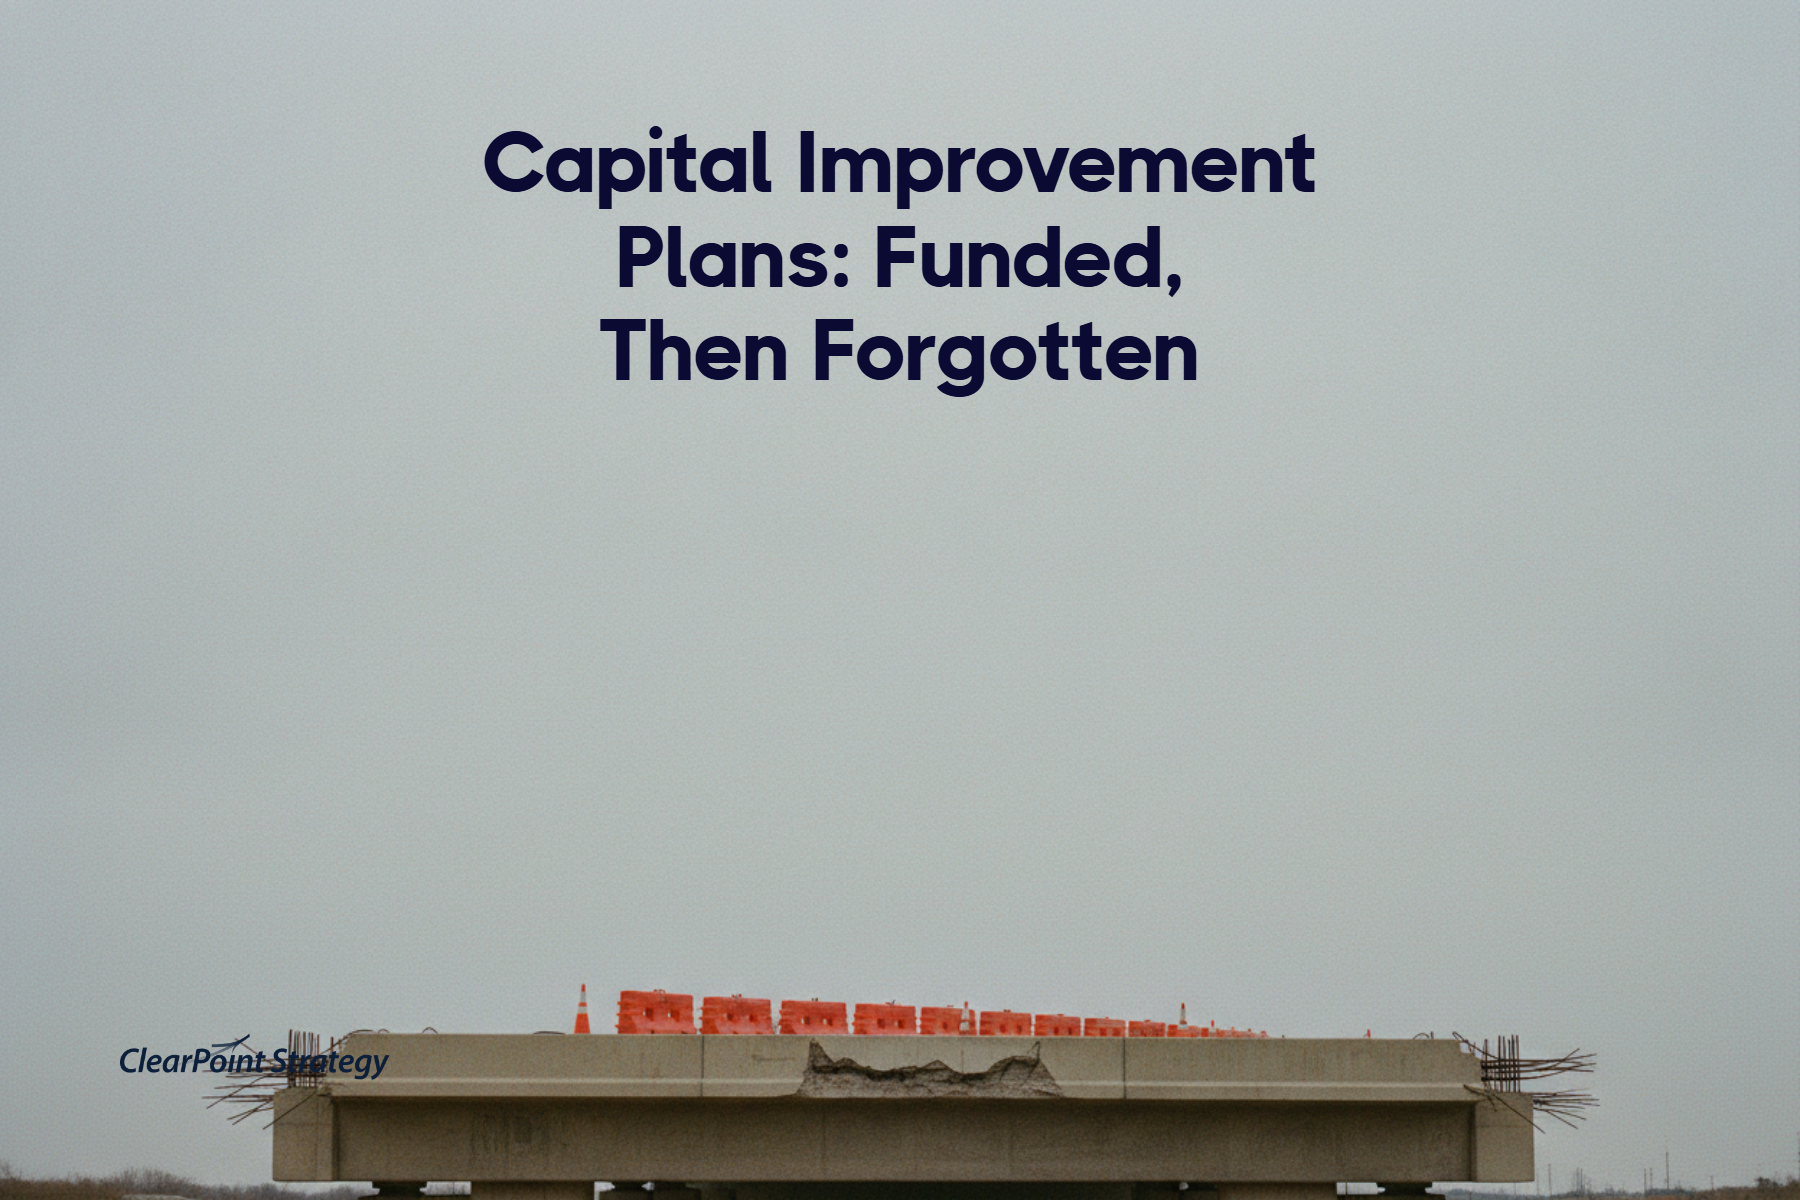

A CIP is easy to write and hard to keep. Of 3,131 local-government capital projects, only 19% ever finish - here's what the cities that finish theirs do right.
Key Takeaways
- A capital improvement plan (CIP) is a multi-year schedule of a local government’s major physical projects — roads, buildings, water systems, parks — with the cost, timeline, and funding source for each. Most span five to ten years.
- The hard part isn’t writing the plan. It’s finishing it. Across 3,131 capital projects in 100 local governments, only 19% were ever marked complete, and 79% of projects past their own deadline were still open in the plan of record.
- The strongest predictor of a finished project is boring: a named owner. Capital projects with an owner are completed 2.7× more often than projects with none — yet 54% have no owner at all.
- A CIP is not a budgeting document. It’s an execution contract. Treat it like a living system — owners, review cadence, one shared view — and it survives past year two.
- Cities like Hayward, CA and Goldsboro, NC already run their CIPs this way, in the open, on ClearPoint.
Somewhere in a city budget office, there is a binder. Five years of capital projects. A road widening, a fire station, a water main that was supposed to be replaced in 2019. Every number in it is real. Every project was approved. And a lot of them will still read “in progress” when the next five-year plan is written.
This is the part of capital planning that never makes it into the guide. So we pulled the data. We looked at 3,131 capital projects across 100 local governments to see where the plan actually breaks — and what the cities that finish their plans do differently.
First, the definition, because you probably came here for it.
What a capital improvement plan is — and what it isn’t
A capital improvement plan (CIP) is a multi-year schedule of a local government’s major physical investments. Think roads, bridges, buildings, water and sewer systems, parks, fleet. For each project, the plan lists the estimated cost, the operating and maintenance cost that follows, a timeline, and where the money comes from. Most CIPs span five to ten years. Five is the most common.
A CIP is not the same thing as a capital budget. The capital budget is one fiscal year of funding. The CIP is the runway — the first year rolls into this year’s budget, and the rest sets the schedule for what comes next. The Government Finance Officers Association (GFOA) draws the line at assets above a set capitalization threshold, often $5,000, with a useful life beyond a single year. Below that line, it’s an operating expense, not a capital project.
So far, so textbook. You can find that definition on a dozen government finance sites, and they are all roughly correct. Here is what they leave out.
The uncomfortable part: funded, then forgotten
A CIP is easy to write and hard to keep. The plan gets adopted with real momentum — a council vote, a press release, a fresh spreadsheet. Then the fiscal year turns. A project manager leaves. A grant slips. And the plan quietly stops matching reality.
We can measure exactly how far it drifts. In our platform data, capital projects in local-government plans finish far less often than the adoption ceremony would suggest.
The completion reality
What happens to a capital project after it’s in the plan
Source: ClearPoint platform data · 3,131 capital projects across 100 local governments · 2026
Read the 79% carefully, because it cuts two ways. Some of those projects really are stalled. Others were finished in the field and simply never updated in the plan — the pavement got laid, but the record still says “in progress.” Both are the same failure wearing different clothes. When the plan stops telling the truth, no one can steer by it. The council asks how the CIP is going, and the honest answer is a shrug.
That is the reframe worth holding onto. A CIP doesn’t fail in the strategy. It fails on a Tuesday, six months after adoption, when the plan and the worksite stop agreeing.
The single biggest predictor of a finished project: an owner
When we split the same projects by one variable — whether a specific person is named as the owner — the gap is not subtle. Projects with a named owner get completed far more often than projects owned by “the department,” which is to say, no one.
The owner effect
Share of capital projects completed, by ownership
Source: ClearPoint platform data · 3,131 capital projects across 100 local governments · 2026
This is the least glamorous finding in capital planning, and the most useful. It’s the same pattern we see across government project performance as a whole: ownership is what moves work to done. You do not need a new software category to close most of this gap. You need a name next to each project — a person, not a division — and a standing habit of asking that person how it’s going. Ownership is what turns a line item into an accountable commitment.
Which capital projects stall the most
The pattern holds across every kind of capital work, but not evenly. Roads, water, and facilities all sit near a one-in-five completion rate and a four-in-five past-due-open rate. The projects that fare worst are the ones that don’t fit a clean category — the “other” capital items that tend to be vaguely scoped and, tellingly, the least likely to have an owner.
| Capital project type | No owner | Completed | Past due, still open |
|---|---|---|---|
| Roads & transportation | 50.9% | 20.2% | 77.6% |
| Facilities & buildings | 56.2% | 21.2% | 76.9% |
| Water, sewer & utilities | 52.1% | 20.1% | 77.9% |
| Parks & recreation | 47.0% | 20.5% | 76.3% |
| Other capital | 59.3% | 13.9% | 85.5% |
Source: ClearPoint platform data · 3,131 capital projects across 100 local governments · 2026
The lesson isn’t “parks are better run than public works.” It’s that the projects with the weakest definition and the weakest ownership are the ones that vanish. Scope it, name it, and it has a chance.
What it looks like when it works
Some cities have already closed this gap, and they didn’t do it quietly. They did it in public.
The City of Hayward, California publishes its entire Capital Improvement Program as a live dashboard that any resident can open. Ten categories, from road and street projects to pavement rehabilitation, municipal facilities, fleet, water, sewer, and airport work. Each project carries a number, a status, and a percent-complete. You can watch “Annual Water Line Replacements FY24” sit at 10% while a traffic control tower renovation reads 100%. Hayward’s 2024–2033 capital program runs to roughly $905 million — and none of it hides in a binder. When a project owner knows the whole city can see the number, the number tends to get updated.
The City of Goldsboro, North Carolina runs the same idea on the inside. Its CIP is a ten-year projection totaling $411 million in planned fund usage, and department heads log in to rank their own projects by priority. Each one is tagged to its funding source — general, utility, stormwater — so a project reads as progress toward a goal, not just a line of spend. Octavius Murphy, Assistant to the City Manager, put the culture plainly: “The city manager really likes data. He’s an analytical guy… so that support system is major for my desk.”
Two cities, two postures — one public, one internal — same move underneath. The plan is a living system that names owners and shows status, not a document that gets admired once and shelved.
How to build a CIP that survives year two
You already know how to write a CIP. The components are settled: a project list, cost and O&M estimates, timelines, funding sources, and a way to rank what comes first. Assemble those and you have a plan. Here is how to keep it alive after the vote.
1. Put a name on every project — a person, not a department. This is the 2.7× move. “Public Works” cannot be called into a meeting. A person can.
2. Give it one shared view. When the plan lives in one place everyone can see — not five spreadsheets and an email thread — status stops being a mystery and starts being a habit.
3. Review on a cadence, not a crisis. A short monthly or quarterly check on every active project catches the slip while it’s still a slip. The plans that die are the ones nobody opens between adoptions.
4. Roll each project up to the goal it serves. A water main isn’t just $2 million of pipe. It’s the “safe, reliable infrastructure” objective in your strategic plan, made concrete. Connect the two and capital spend reads as strategic progress the council can follow.
5. Consider making it public. A resident-facing dashboard is not a vanity project. It’s the strongest accountability mechanism a city has, because owners update what the public can see. Hayward proves the point every day.
That last mile — owners, status, one live view of every capital project — is exactly what ClearPoint was built to run. If you want to see it on your own plan rather than read about it, ask for a walkthrough.
Sources & methodology
The completion, ownership, and timing figures in this article come from ClearPoint’s own platform data — an anonymized analysis of 3,131 capital-project initiatives across 100 municipal and county governments, current to 2026. Percentages describe that cohort; no single client is identified. The $5,000 capitalization threshold and the multi-year framing follow GFOA guidance. The public-dashboard example is the City of Hayward’s live CIP dashboard; the internal-CIP example and the Octavius Murphy quote come from the City of Goldsboro case study.
The plan is a promise
A capital improvement plan is a promise a city makes to itself about the next ten years. Writing the promise is the easy half. Keeping it — project by project, owner by owner, review by review — is the work. The cities that finish their plans aren’t the ones with the fanciest binder. They’re the ones who never let the plan and the worksite stop agreeing.