Get answers like this one, first.
Google’s AI Overviews now favor the sources you choose. Add ClearPoint once, and our research shows up in your AI answers — badged and prioritized.
Add ClearPoint as a Preferred SourceFree · one click · applies only to your own Google results.

Energy & Utilities organizations complete 25.81% of strategic projects—the highest of any industry. Here’s what they do differently.
Most industries treat strategic planning as an annual ritual. Build the plan in November. Launch it in January. Revisit it in December (when you realize how little got done).
- Energy and utilities post a 25.81% project completion rate — the highest of any industry and roughly double the cross-sector average near 12.5%.
- Utilities plan for complexity rather than avoiding it, carrying the highest milestone counts of any sector at a median of 20 active milestones per plan.
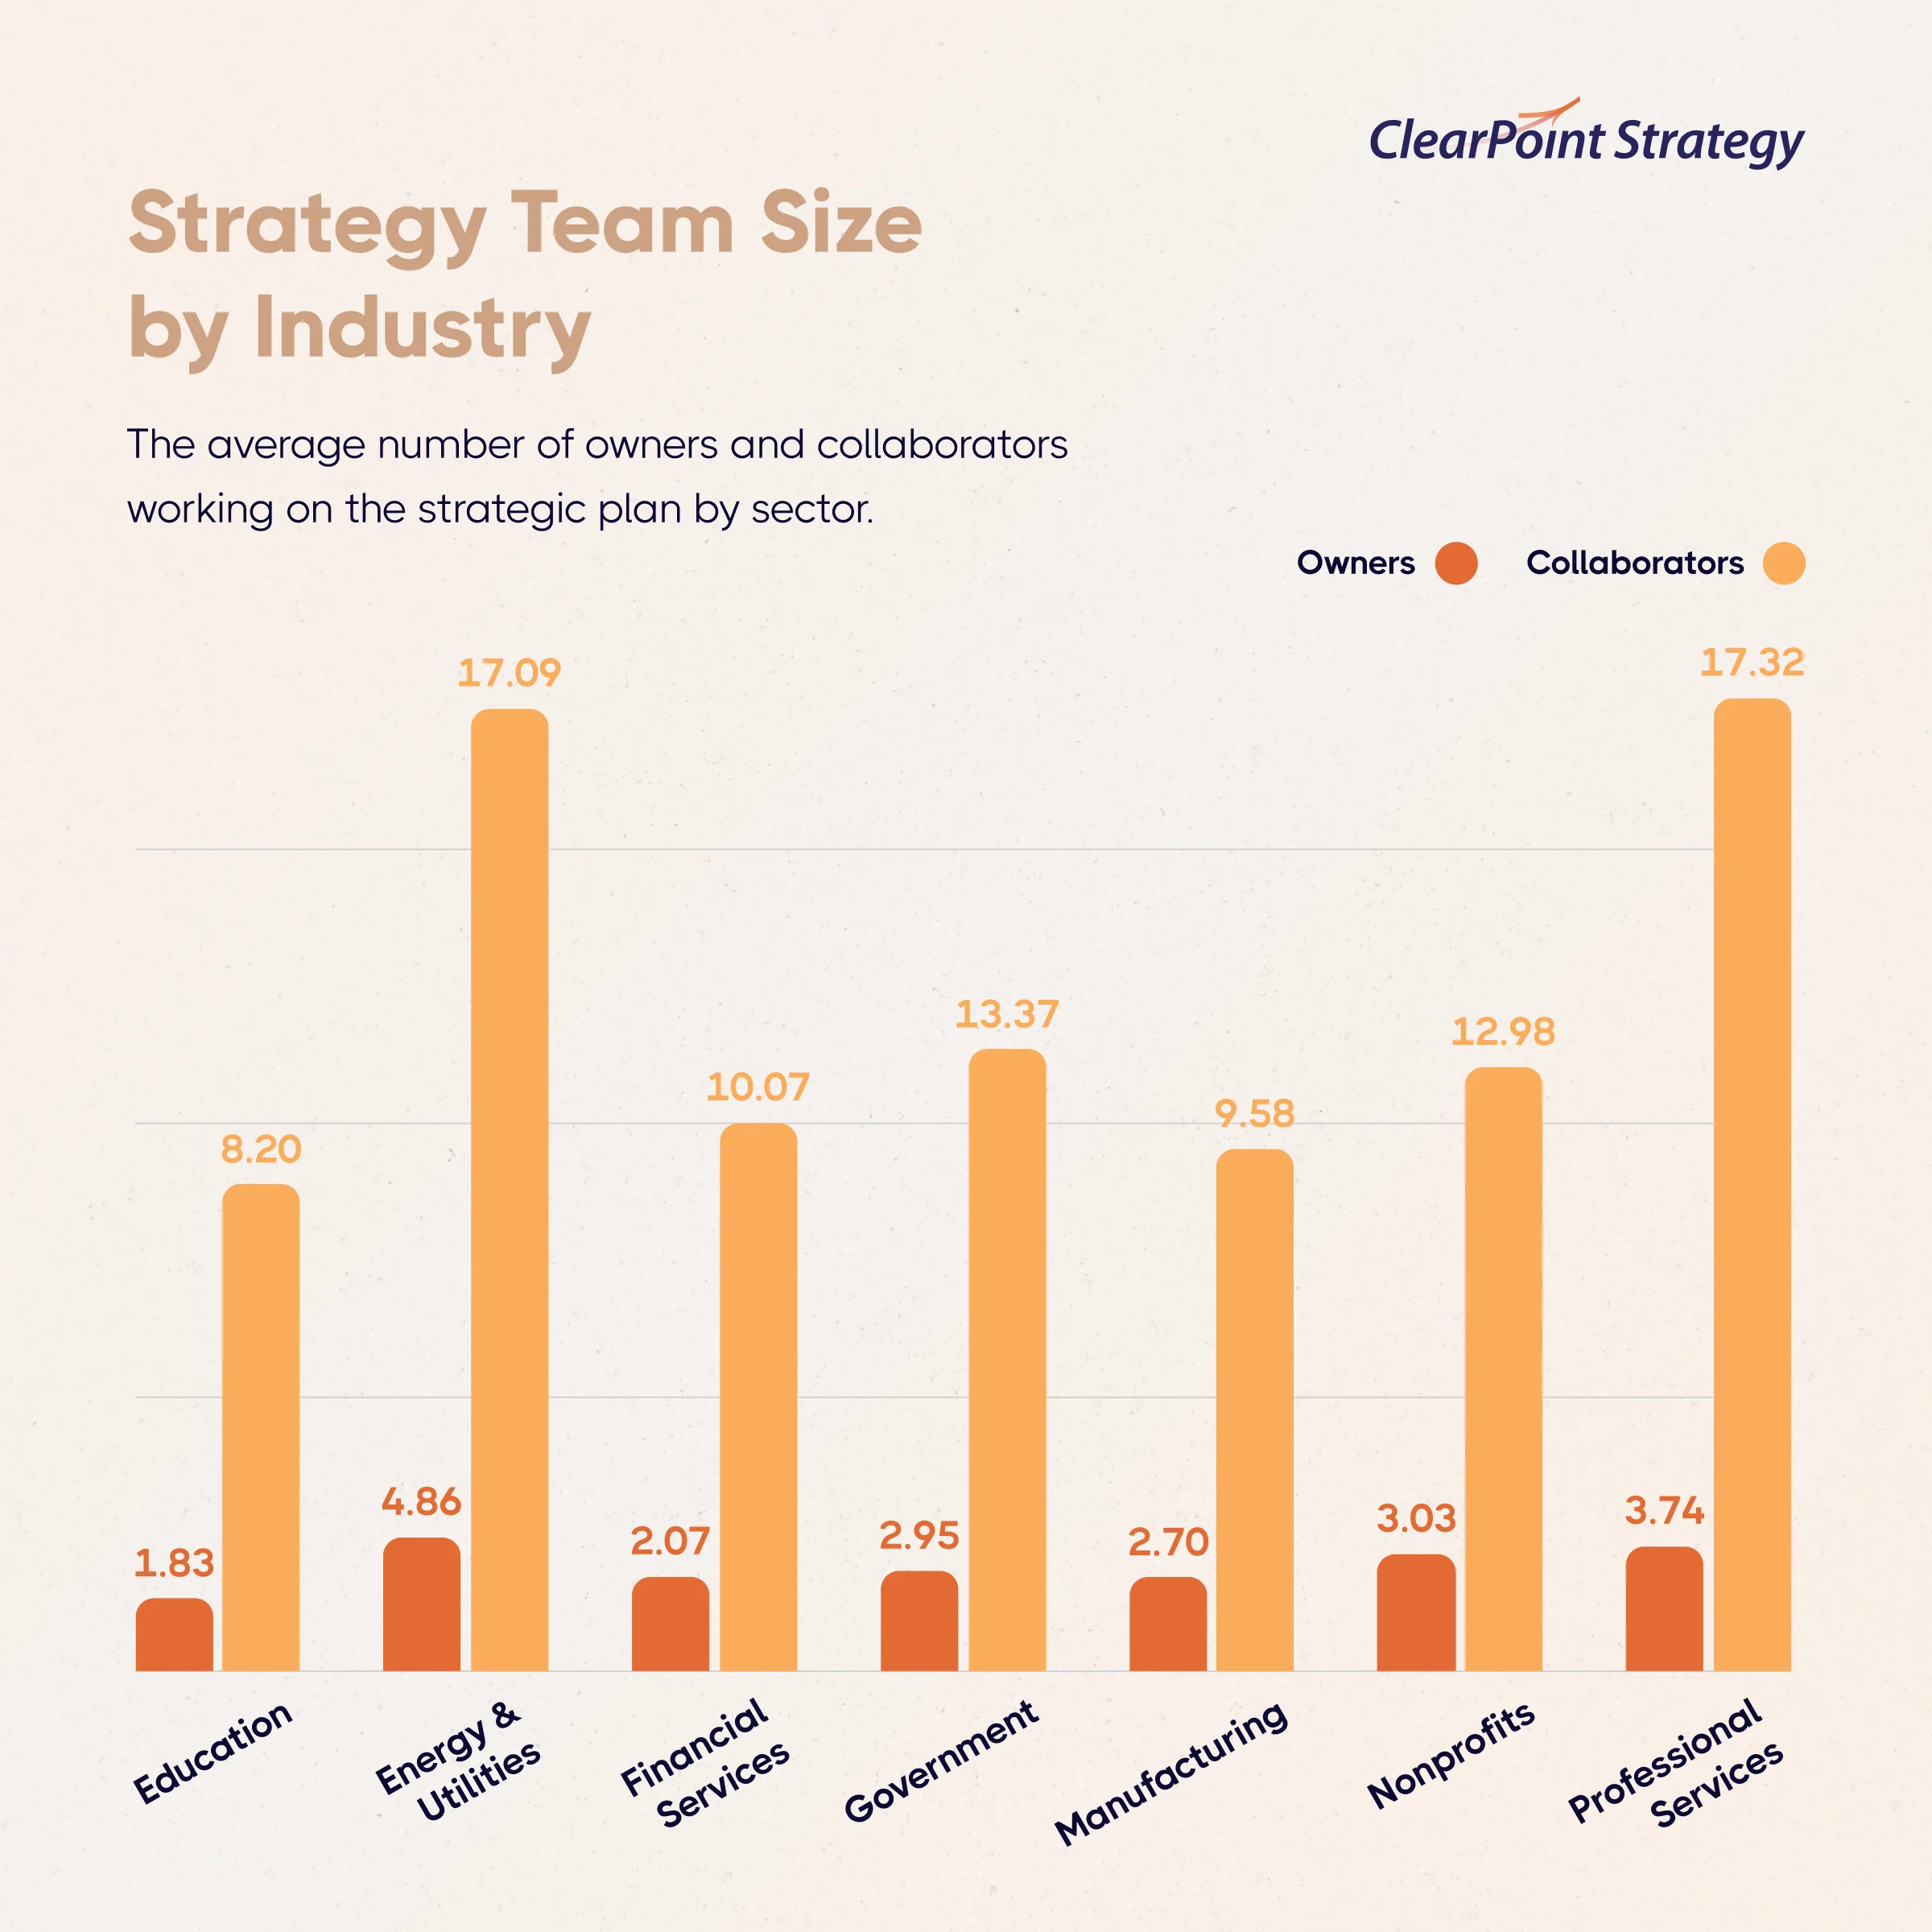
- They staff the work, fielding an average of 4.9 owners per initiative with 3.5 collaborators per owner — enough support without diluting accountability.
- Continuous regulatory reporting turns external accountability into internal habit, spreading work across the year instead of clustering it at fiscal close.
- Complexity is still a risk — plans with 60-plus elements succeed only 8% of the time — so utilities win by governing complexity, not by avoiding it.
Energy and utility companies do something different. The data proves it.
ClearPoint’s 2026 Strategic Planning Report analyzed 31.2 million rows of activity data across 20,582 strategic plans spanning seven industries. One finding stands above the rest: Energy & Utilities are the best executors of strategy, and it isn’t close.
Get all the strategy data associated with high-performing organizations—and learn what to avoid doing! Download the 2026 Strategic Planning Report now.
The Numbers That Set Utilities Apart
Start with project completion—the clearest measure of whether a strategic plan actually works.
- Energy & Utilities: 25.81% project completion rate—the highest of any industry
- Cross-sector average: ~12.5%
- Nonprofits (lowest): 5.29%
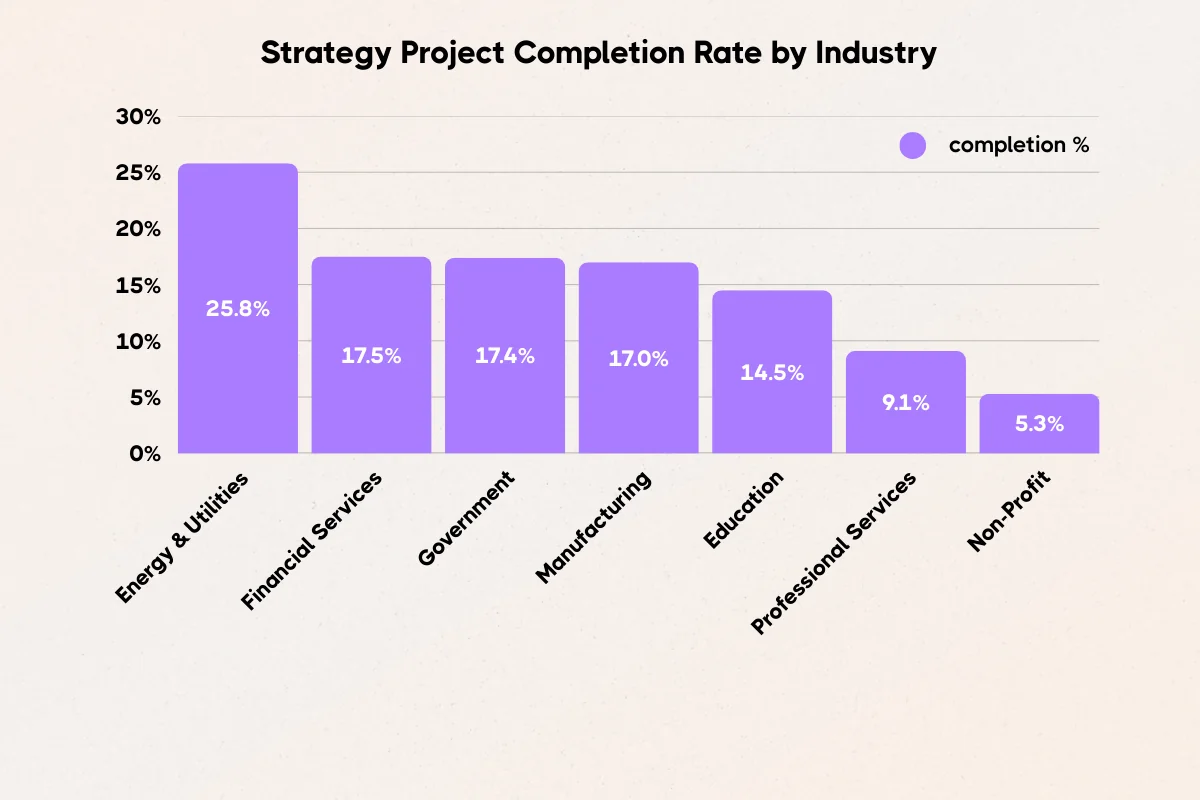
Utilities complete strategic projects at nearly 5x the rate of nonprofits and more than double the cross-sector average.
That gap doesn’t happen by accident. It reflects structural differences in how utilities build and run their plans.
Why Utilities Execute Better: The Structural Advantages
1. They Plan for Complexity
Utilities don’t shy away from detailed plans—they just know how to govern them.
The data shows Energy & Utilities organizations carry the highest milestone counts of any sector, with a median of 20 active milestones per plan. That’s not bloat. That’s precision. Regulated industries have to break large capital projects into trackable stages. The result is a planning discipline that translates directly into execution.
Where other industries add milestones and lose focus, utilities use them as accountability checkpoints.
2. They Staff the Work
Utilities field the most robust strategy teams in the dataset:
- Average of 4.9 owners per strategic initiative—the highest of any sector
- 3.5 collaborators per owner—enough support without diluting accountability
Compare that to nonprofits, which average just 3.03 collaborators per plan total. Utilities don’t just assign work. They staff it.
Every element has someone responsible. Every owner has support. That combination drives completion.
3. Regulatory Pressure Creates Execution Discipline
Utility companies operate under regulatory frameworks that require them to document commitments, track progress, and report results—not annually, but continuously. That external accountability creates internal habits. When you have to show a regulator what you did, you build systems to track what you’re doing.
Strategic planning stops being a document exercise. It becomes an operating system.
4. They Spread Work Across the Year
The report shows most organizations cluster project due dates in December and June — a “launch in January, close at fiscal year-end” pattern that creates predictable bottlenecks.
Utilities, managing capital projects that span years rather than months, naturally spread delivery across the calendar. The median project duration in the dataset is 364 days. Utilities are comfortable with yearlong execution timelines and build governance structures to match.
That cadence discipline is a core reason their completion rates hold up.
What Other Industries Can Learn
The utilities playbook isn’t exotic. It’s disciplined. Three practices stand out:
- Name owners at the milestone level, not just the goal level. Most industries assign ownership at the top and hope accountability trickles down. Utilities assign it at every stage. With a median of 20 milestones per plan, there’s no ambiguity about who owns what, when.
- Staff strategy like a project, not a meeting. A strategy pod with 4–5 owners per initiative means the plan has people whose job is to make it move. Not a committee that reviews it quarterly but people who own it daily.
- Use regulatory-style reporting internally. You don’t need a regulator to hold you to this standard. Build internal reporting that requires the same specificity: what was committed, what was delivered, what’s next. That discipline is available to any organization willing to adopt it.
Replicate Utilities' Edge with the Right Platform
![]() Utilities don't execute better by chance—they've engineered governance into their DNA: milestone-dense plans, multi-owner staffing, regulatory-style reporting, and year-round cadences.
Utilities don't execute better by chance—they've engineered governance into their DNA: milestone-dense plans, multi-owner staffing, regulatory-style reporting, and year-round cadences.
ClearPoint Strategy delivers that infrastructure out of the box, turning any organization's strategic plan into a living operating system like the energy sector's. ClearPoint supports:
- Milestone precision at scale. Utilities run 20+ milestones per plan as accountability checkpoints. ClearPoint lets you build the same granularity instantly—link projects to measures, auto-generate dashboards, and track every stage without manual sprawl.
- Staffed initiatives, not silos. Match utilities' 4.9 owners and 3.5 collaborators per initiative. Assign roles, notify teams, and monitor ownership chains in real time, ensuring no element lacks a driver.
- Continuous reporting, regulator-ready. Skip annual rituals. ClearPoint's automated reports show committed vs. delivered progress monthly (or daily), mimicking utilities' external accountability to build internal discipline.
- Year-round cadences. Spread due dates like utilities' 364-day projects. Dynamic timelines and AI-driven risk alerts prevent bottlenecks, sustaining 25.81% completion rates across complex plans.
Other industries can adopt this today—no regulators or massive teams needed. ClearPoint's unified view connects strategy maps, initiatives, and KPIs, helping you hit utilities' benchmarks.
Take the first step toward executing like the top sector: Demo ClearPoint today.
The Honest Read on Utilities
Utilities aren’t perfect. Their plans carry more complexity than most—and complexity is a risk. Plans with 60 or more total elements succeed just 8% of the time across the dataset.
The reason utilities manage that complexity better isn’t that they’re immune to it. It’s that they’ve built the governance infrastructure to handle it: clear ownership chains, milestone-level accountability, and reporting cadences that don’t wait until December to check in.
That infrastructure is learnable. The data just shows utilities figured it out first.
Data sourced from ClearPoint Strategy’s 2026 Strategic Planning Report, which analyzed 31.2 million rows of activity data from 20,582 strategic plans spanning 2017 to 2024.
Download the full 2026 Strategic Planning Report for complete benchmarks, methodology, and industry comparisons.